

Decoding the Market Spiral and Finding Opportunity in the Carnage
READ NOW 🚨


Hello, and welcome to our latest market update.
The past two weeks have shown us something deeply concerning: the structural floor beneath this market has cracked. Bitcoin’s unprecedented weakness at key support levels, combined with a reflexive collapse from the MicroStrategy empire, has exposed a dynamic that few traders accounted for during the bull run. What looked like perpetual upside momentum has revealed itself as leverage and concentration in a single actor. And that actor is now fighting for survival.
This edition breaks down what is actually happening below the surface, explains why the feedback loop is so dangerous, and outlines the exact catalysts that could spark either a capitulation washout or a grinding sideways chop through the rest of the year. More importantly, we show you where the real opportunities are hiding, not in the headlines everyone is reading, but in the structural damage that is still being priced in.
Here is everything we are going to cover:
The Structural Breakdown
The MicroStrategy Problem
Market Seasonality
Timing Altcoin Risk
Opportunity Selection
Let us get into it.
What to Watch: Where Does Bitcoin Close This Week
Before we walk through the full analysis, here is the simple version for anyone who needs it in one sentence.
If Bitcoin holds above the 61K level on a daily close, we have room to stabilize in the 63K to 68K range where the market can digest recent losses. But if we break decisively below 60K and continue lower, the technical picture becomes properly broken, and the next major support sits substantially lower in the 52K to 55K region.
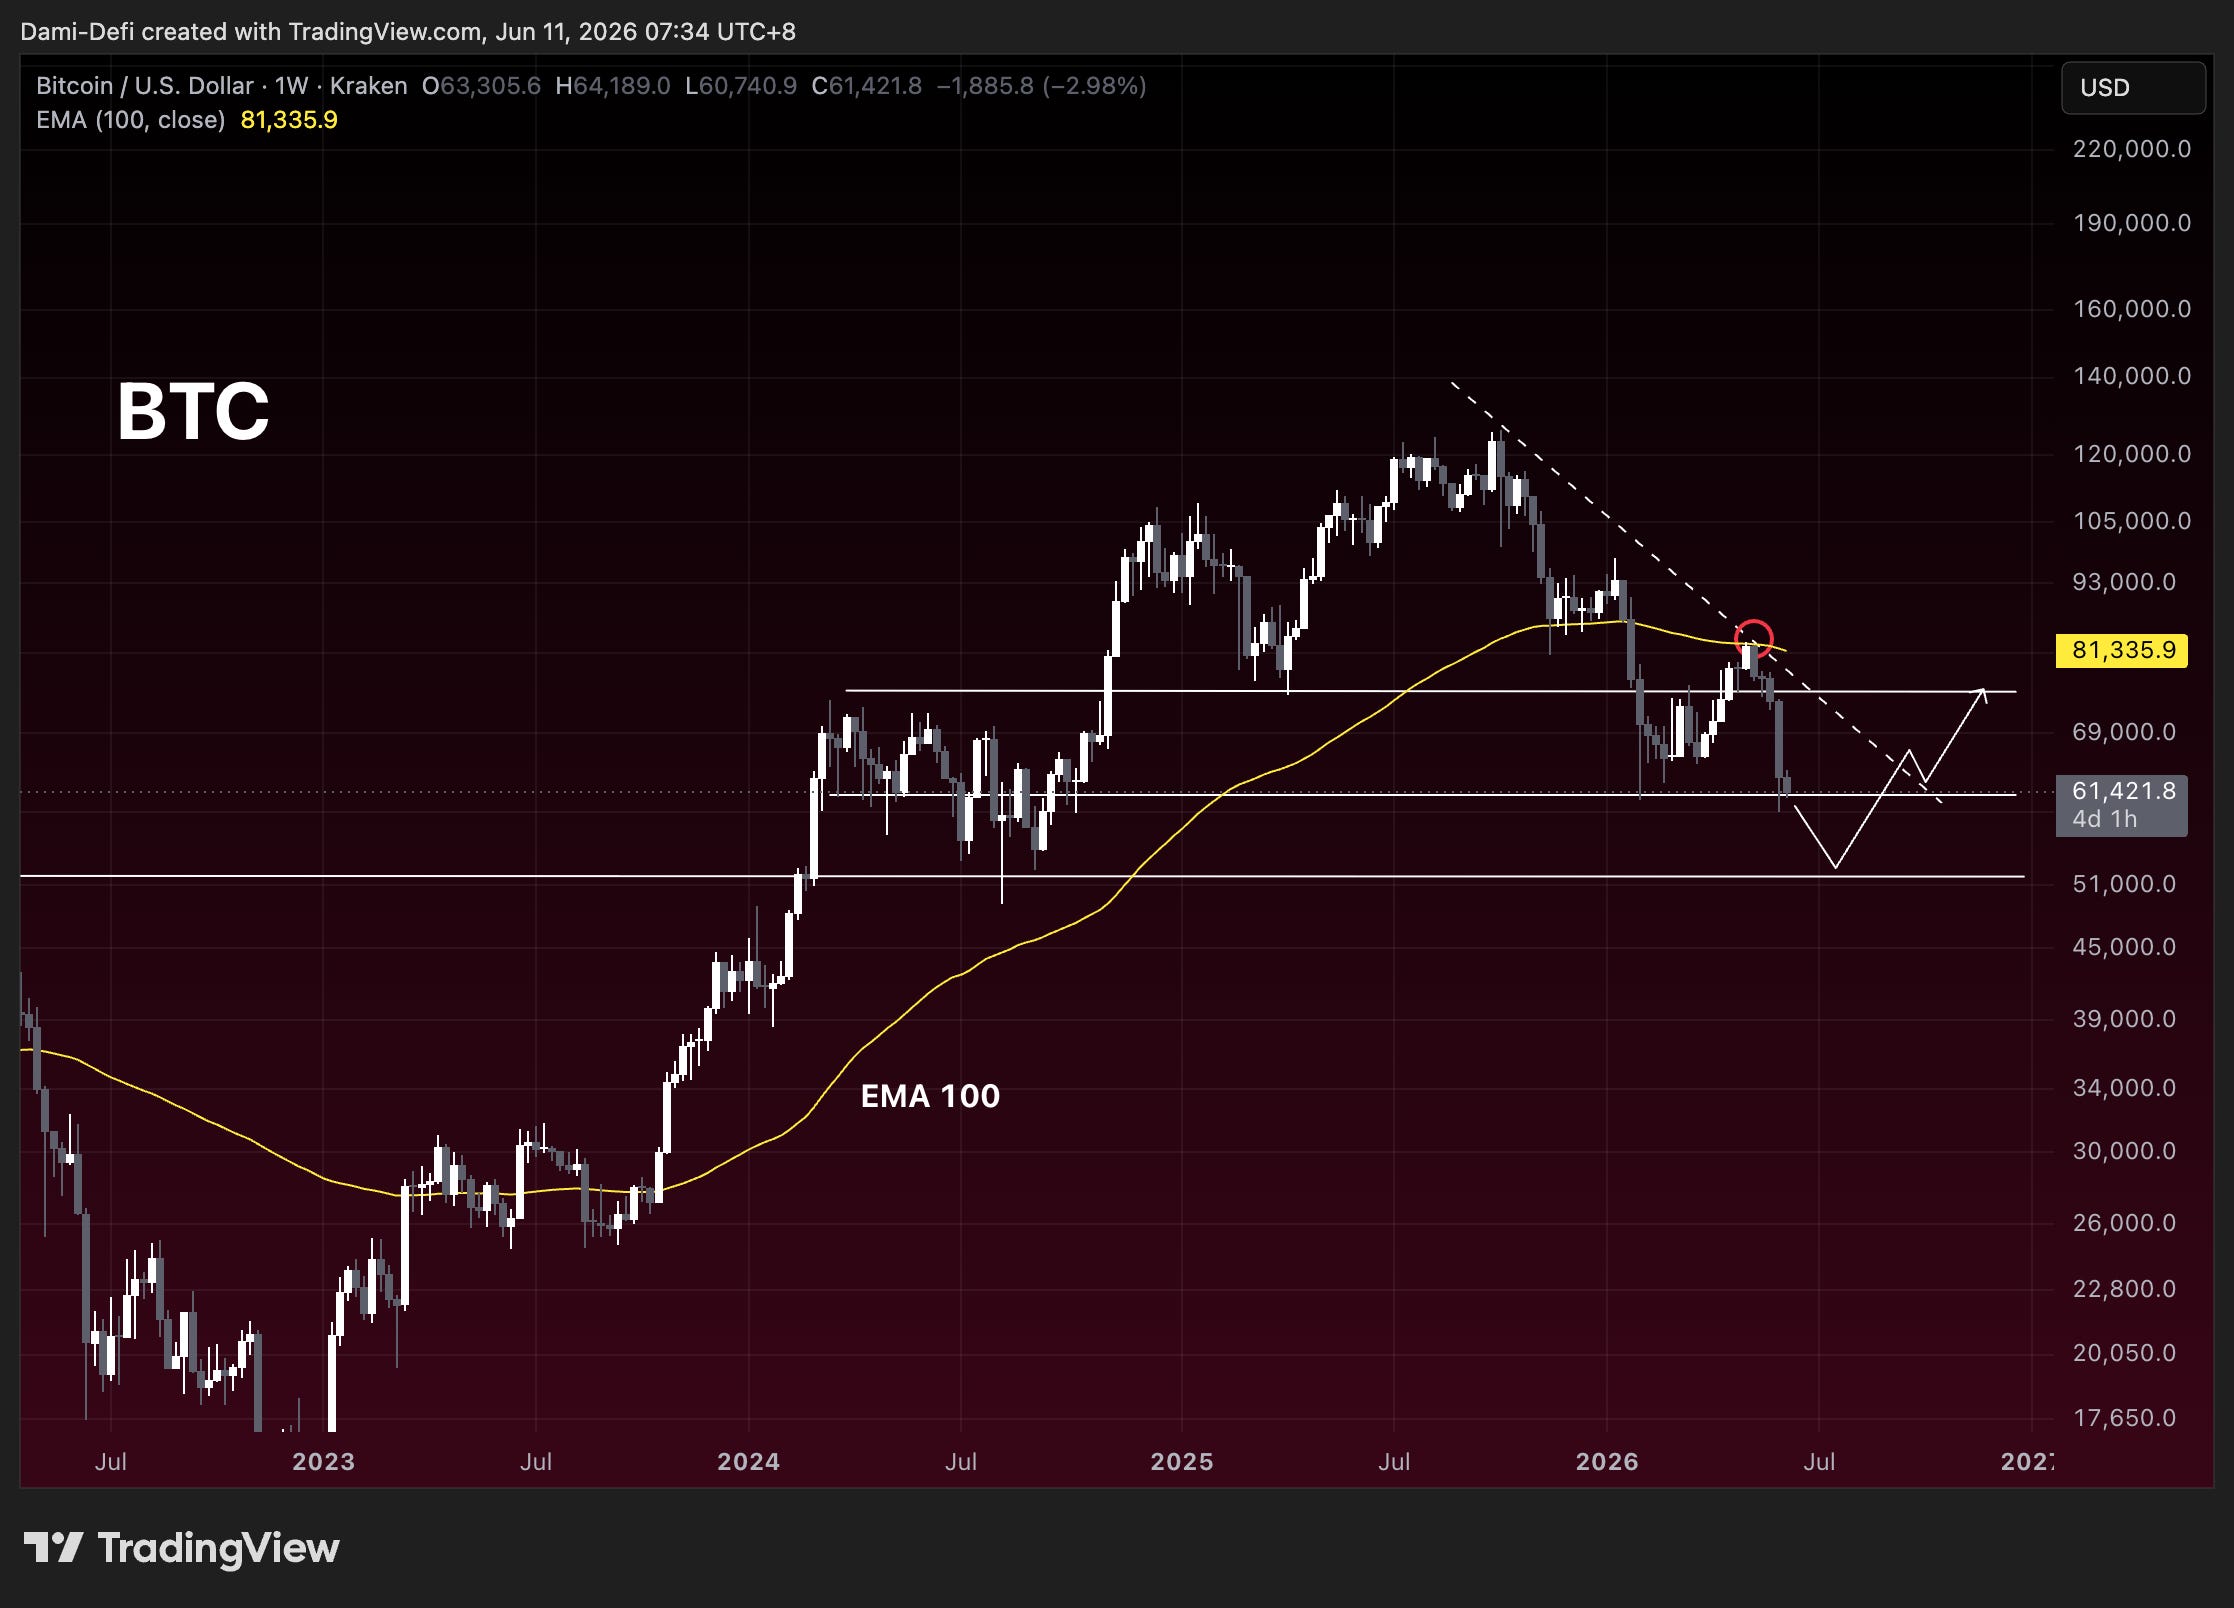
$BTC is trading below both the weekly SMA 50 at $91,733 and the EMA 100 at $81,359. Both are now overhead resistance. That’s not a healthy structure.
The descending pattern of lower highs since the $130K ATH is still intact — $130K, then $100K, then $84K. Every bounce has been sold. $75K is now resistance after being support for months.
The one thing worth watching is the RSI at 33. The last time the weekly RSI was this low was the 2022 bear market bottom. That doesn’t mean we’re bottoming — but it means the selling pressure is reaching historically extreme levels. The MACD is still deeply negative but the histogram is beginning to compress.
$51K is the next real support if current levels don’t hold. Reclaim $75K on a weekly close and the read starts to change. Until then the structure is bearish.
The View From 30,000 Feet
Start here. Always start here. This is the chart that establishes your macro thesis and everything else is context layered on top.
Bitcoin is currently trading at approximately 61,700 USD with a total market capitalization of 1.24 trillion dollars. The one most important observation on the longer timeframe is that we have rejected off previous all-time high levels established at 126,200 on October 7, 2025. This is not an arbitrary rejection. Look back through Bitcoin’s entire price history and you will see the same behaviour repeat: when Bitcoin rejects off all-time highs without consolidating properly, it has often led to multi-month corrections before establishing new bases.
The price action from the 126K level down to current levels tells us something critical. The rise was driven by institutional capital flowing in through ETF products, combined with a single very large actor accumulating at accelerating rates. When that actor hit structural limits on their ability to purchase more without crushing their own balance sheet, the bid disappeared almost overnight.
There is also a critical zone on the monthly chart around $58K to 62K where Bitcoin spent extended periods building during the 2024 accumulation phase. This zone now represents old resistance that flipped into support. The question now is whether it actually holds.
What to watch is simple: monthly closes relative to this critical zone at 58K to 62K.
If we hold above it and especially if we reclaim the 68K to 72K range, the broader bull case stays intact. The setup maps out as: hold the zone, test higher levels, and eventual expansion to new highs. That is the optimistic scenario.
If we lose it on a monthly close, not an intraday wick but a closing candle, the damage becomes real. The lower demand area where long-term buyers historically step in becomes the next destination. That region sits considerably lower than we are now and would involve significant pain.
Monthly charts set your macro bias and your overall posture. Everything else flows from this foundation.
Structure Is Already Damaged
If the monthly tells you the macro bias, the weekly tells you where you currently sit within that story. And the weekly structure is concerning.
Bitcoin lost a key weekly support band that was running through the 68K to 70K region. That was a significant regime shift. A level that was previously attracting buyers on every touch now has sellers waiting on any bounce back to it. Support has flipped to resistance, and it is working against bulls, not for them.
As long as BTC trades below that broken support zone, the weekly bias is bearish. Rallies within this context are corrective moves inside a downtrend, not the beginning of trend resumption. That distinction matters enormously for position sizing and your entry strategy.
The levels that matter most in the immediate term are the zones at 58K to 62K. This is now the critical nearby pivot. Price has been hovering around it, compressing, and repeatedly failing to break with conviction to the upside. Every rejection at resistance reinforces the bearish weekly structure.
If this support zone fails to hold on weekly closes, the math becomes stark. The next meaningful magnet is the level around 48K to 52K. This is not speculation. This is where the market spent significant time before the 2024 breakout began, making it a gravitational pull if things deteriorate further. That 52K level is a number you do not want to become relevant. But you need to know it is sitting there.
The scenario this chart maps out is: sideways chop into a potential breakdown attempt. I want to be explicit: this is a scenario framing, not a guaranteed outcome. The weekly structure has spoken. You trade the reality in front of you, not the outcome you are hoping for.
The Warning Nobody Wants to Hear
This is the chart that should make you uncomfortable. Not because we are being alarmist, but because the setup is objectively worth respecting.
When you zoom to the daily timeframe, a pattern emerges that mirrors a critical moment from late 2022. Bitcoin spent weeks inside a clearly defined box, roughly spanning the 62K to 72K range. The price action felt stable. Buyers kept showing up at the floor. The market appeared to be building a base that would launch higher.
Then the box broke. BTC dropped more than 30 percent in the span of a few days.
What looked like consolidation was actually accumulation by long-term buyers preparing for the bear market. The range was not a launching pad. It was where smart money was distributing into retail hands.
Now look at the current daily setup from late February to early June 2026. The structure is remarkably similar: a defined range spanning approximately 58K to 68K with repeated rejections at the top and repeated tests of the floor. The market is stuck in exactly the same kind of compressive chop.
This is not a prediction that the market will replicate 2022 perfectly. Markets do not move in exact repeats. But the psychological mechanics of distribution look identical every cycle. Sellers cap upside at the same level repeatedly. Buyers absorb until they cannot absorb anymore. Then the floor breaks.
The projected path on this daily analysis is: chop, breakdown, potential move toward the lower support zone. That number aligns with the weekly chart’s 52K level. When multiple independent timeframes converge on the same target, it deserves serious weight in your analysis.
The invalidation is equally clear: if Bitcoin breaks above this range on daily closes and holds that breakout, this bearish daily setup collapses entirely. Until then, it remains a legitimate scenario.
The Actionable Roadmap
This is where macro context meets real execution. The 4-hour chart is the bridge between the big picture and what you actually do with your capital right now.
Bitcoin has been oscillating between two clearly defined boundaries.
Yellow resistance at approximately 68K. This level has been rejected multiple times. Each time buyers attempted to push through, sellers stepped in and shut it down. Multiple rejections from the same level are not noise. It is an active wall.
White support zone at approximately 61K. This has been defended multiple times with clean bounces. This is where demand has repeatedly shown up. It is the floor of the current range.
This is classic compression: the more times a level is tested from both sides without resolving, the more energy builds behind the eventual break. The market is coiling. When it moves, it will move fast and it will likely catch the middle, the people who were neither at an extreme nor waiting for confirmation.
Bull trigger: a clean 4-hour break and hold above the resistance at 68K. That flips resistance into support and opens continuation toward the upper range. You want to see the close above the level, not just the wick.
Bear trigger: the support zone at 61K fails on a 4-hour close. The range breaks down. The market goes looking for the next liquidity pocket, and based on everything above, you know what that target is.
The rule here is simple: do not trade the middle. Entering positions in the midpoint of a defined range is the lowest conviction trade you can make. Either trade the extremes, buy tested support with a defined stop, sell tested resistance, or wait for a confirmed breakout before adding size. Every position initiated in the middle of this range is effectively a coin flip, and you do not need to play coin flips.
Stitching the Full Picture Together
Here is the top-down narrative with all four timeframes combined.
Monthly sets the macro bias: the 58K to 62K zone is the line that separates this market from a meaningful trend break. Monthly closes above it keep the structural case alive. Lose it and the damage takes months to repair.
Weekly confirms the current structure: damage has already occurred. BTC is below broken support. Rallies are corrective until that zone is reclaimed. The 68K region is the nearby pivot. 52K is the magnet if things continue to deteriorate.
Daily adds the pattern risk: the 2022 analog is alive and well. Sideways chop inside a range is not inherently safe. It is the setup for a violent resolution in either direction. A break above the box invalidates the analog. A break below confirms it.
4-hour gives the execution framework: range between 61K support and 68K resistance. Trade the edges. Wait for confirmation. The next major directional move begins with a confirmed break of one of these two boundaries.
What to watch above all else: how does Bitcoin close the next weekly candle specifically relative to the 58K to 62K zone. That is the most important data point of the next seven days. Everything else is noise until we see where that candle prints.
Remain patient. Manage risk. This is not the environment for maximum exposure. This is the environment for maximum attention.
The MicroStrategy Feedback Loop
Now let us discuss what is actually driving this breakdown at a fundamental level. Because price action alone does not tell the full story. The culprit is concentration risk made visible.
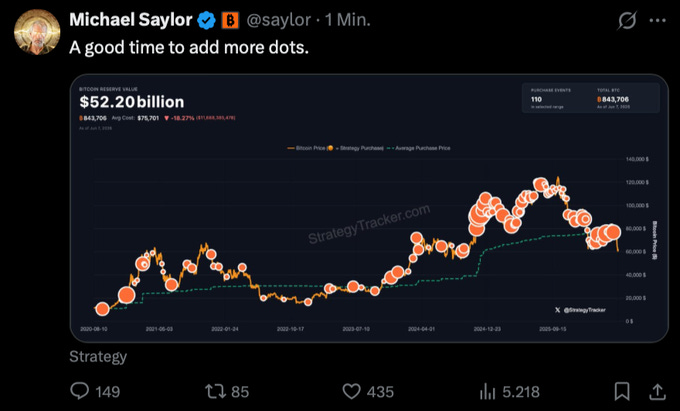
MicroStrategy, now operating under the ticker MSTR, has positioned itself as the world’s largest corporate Bitcoin holder. As of early June 2026, the company holds approximately 843,700 BTC, representing roughly 4 percent of the total circulating supply. They acquired these holdings at an average cost of approximately 75,700 per BTC, for a total investment of 63.87 billion dollars. At current prices near 61,700, those holdings are valued at approximately 51.12 billion dollars, translating to an unrealized loss of 12.75 billion dollars.
The business model is elegant in concept but brittle in execution. MicroStrategy raises capital through convertible notes and preferred equity. They then deploy that capital to purchase Bitcoin, banking on price appreciation to generate returns. When Bitcoin rises and their equity appreciates, they can issue new stock at a premium to previous holdings. That premium capital is then used to pay back debt and purchase more Bitcoin. It is a reflexive loop that amplified the bull run spectacularly.
But that same mechanism works in reverse.
As Bitcoin declined from highs near 126K down to current levels, MicroStrategy’s stock price declined from highs near 317 down to current levels around 120. That decline collapsed the premium at which they could issue new equity. Without that equity premium, they cannot issue stock efficiently. Without efficient equity issuance, they cannot service their debt obligations through normal refinancing. That creates acute pressure.
For the first time since 2022, MicroStrategy sold Bitcoin. Specifically, they sold approximately 32 BTC to fund dividend payments on their perpetual preferred stock. That sounds minor. It is not.
The symbolic significance is immense. Michael Saylor, the executive chairman, has been the loudest voice in the world on Bitcoin accumulation. He has stated repeatedly that MicroStrategy will never sell. And yet he just did. Not because they wanted to. Because they had to.
Now the market is wondering: if he had to sell to meet obligations, what happens if the situation deteriorates further? What if MicroStrategy has to sell hundreds of millions of dollars worth of Bitcoin not out of strategic choice but out of necessity?
That fear alone is creating a reflexive cycle. Bitcoin falls. MSTR stock falls more. The premium collapses further. This forces more sales. Which pushes Bitcoin lower. Which creates more fear. It is a vicious feedback loop.
The bare case is that MicroStrategy eventually has to offload a meaningful portion of their holdings to service debt and preferred dividend obligations. That could easily total 50 to 100 billion dollars in selling pressure over the next 12 months if Bitcoin remains at current levels or declines further.
The base case, and this is probably the most likely outcome in our assessment, is that Bitcoin stabilizes somewhere in this 58K to 72K range. MicroStrategy manages their obligations through a combination of modest asset sales, equity issuance at new lower valuations, and restructuring their debt into longer-dated instruments. A new catalyst emerges, potentially cyclical and seasonal, that restores bid to the market. The MSTR situation becomes less acute. The news cycle moves on to a new narrative. And the price action gradually works higher over the next 6 to 12 months.
The bull case is that Bitcoin reclaims its uptrend before MicroStrategy faces an acute crisis. This could happen if there is a new catalyst for Bitcoin strength: regulatory clarity, ETF inflows resuming, or broad risk-on sentiment returning. If Bitcoin can get back to 80K to 85K levels, MicroStrategy’s equity premium would stabilize, their debt becomes serviceable again, and the reflexive loop reverses. At that point, they become a buyer again rather than a seller, and the cycle reinforces itself on the upside.
Each of these scenarios has dramatically different implications for where Bitcoin heads over the next 3 to 6 months. Our base case assumption, for tactical positioning purposes, is the middle scenario. We expect sideways grinding through the summer months with potential for a sharper move lower in Q3 as seasonal factors compound. Then the fourth quarter could provide some relief if the market has properly digested the MicroStrategy overhang.
The Zcash Catastrophe
While Bitcoin is dealing with structural issues, the altcoin space has been hit by an existential crisis that forces us to re-examine our entire approach to this asset class.
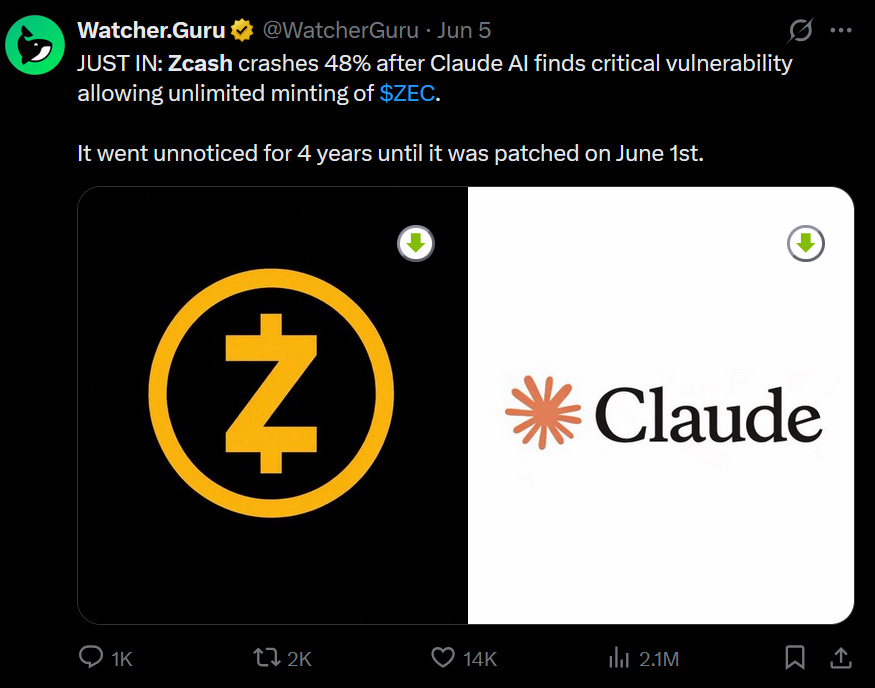
Zcash, one of the leading privacy-focused cryptocurrencies, was found to have a critical vulnerability in its underlying privacy mechanism. The Orchard privacy pool, which is supposed to be the fortress of the Zcash protocol, contained a bug that would have allowed an exploiter to mint infinite tokens. Not just any tokens. Undetectable tokens. Inside a privacy pool, no one would be able to verify how much supply was minted or if new tokens were created at all.
This is an existential threat to a privacy cryptocurrency. Because the entire value proposition depends on trustlessness and verifiable supply. If you cannot verify supply, the trust is gone.
What makes this incident even more noteworthy is how the bug was discovered. A security research team, with the help of Claude Opus 4.8 (an AI model), uncovered the vulnerability. Think about that for a moment. An artificial intelligence system was able to find a critical bug in a cryptocurrency protocol that the core developers and security specialists had missed.
This opens a pandora’s box of questions. If Opus 4.8 can find this bug, what happens when more advanced models are released next year? What happens when bad actors start using these same AI tools not to find bugs but to exploit them? The implications extend far beyond Zcash. Every smart contract, every protocol, every DeFi primitive is potentially vulnerable to discovery by AI systems.
The good news is that the Zcash team has proposed a fix. The Ironwood upgrade will address the vulnerability and restore verifiability to the supply. Markets initially dumped the token hard, with Zcash trading from highs near 592 down to lows near 230 within days. But as confidence in the technical solution increased, the token has begun recovering.
Zcash is currently trading near 468 USD with a market cap of approximately 7.8 billion dollars. The token has rebounded approximately 16 percent in the last 24 hours as the Ironwood upgrade gains traction.
The implication here is subtle but critical. This incident will flush out protocols that do not have the resources or technical depth to survive scrutiny from advanced AI systems. It will benefit the protocols that are hardened, audited obsessively, and have deep technical teams. In the long run, this is probably healthy for the crypto ecosystem. In the short run, this creates massive volatility and risk.
We are taking a cautious approach to Zcash at current levels. We are not selling at these depressed prices because the long-term privacy narrative is still intact. But we are also not aggressively accumulating. We are waiting to see if the trust repairs meaningfully after the Ironwood upgrade is fully implemented. If it does, the recovery could be substantial. If trust remains damaged, Zcash could trade lower.
What we are more interested in is how other privacy coins react to this news. Monero (XMR), which uses a different privacy mechanism that is less vulnerable to the types of exploits that Zcash faced, could attract some of the capital fleeing Zcash. The broader question is whether privacy coins as an entire category become viewed as too risky given the AI security threat.
